| Camtasia Studio是TechSmith旗下的一套专业屏幕录像软件,同时包含Camtasia 录像器、Camtasia Studio(编辑器)、Camtasia 菜单制作器、Camtasia 剧场、Camtasia 播放器和Screencast的内置功能。 SciencePlots科研绘图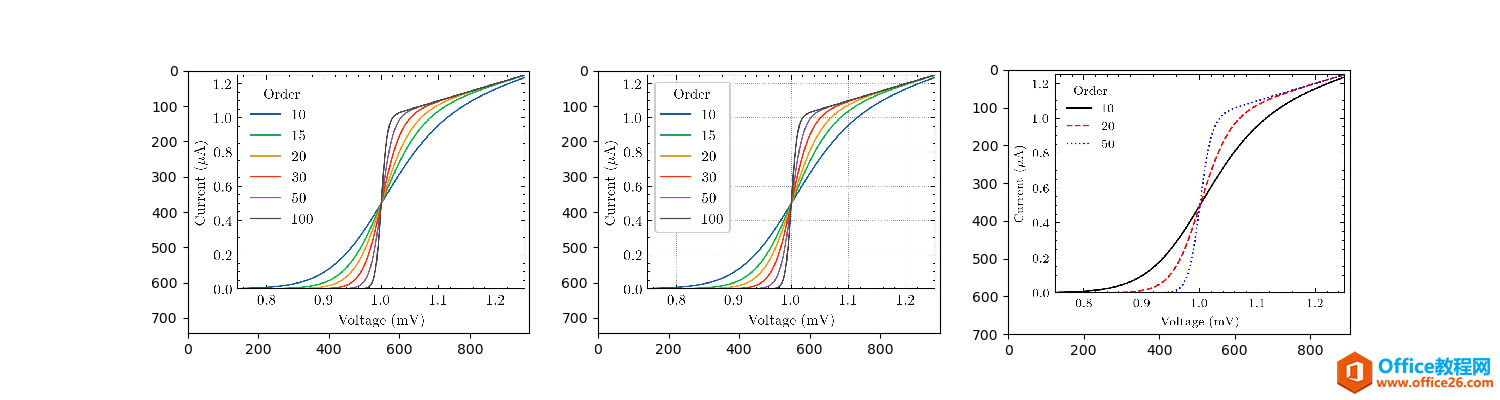
简介使用Python作为核心开发工具的机器学习和深度学习研究者自然会希望使用Matplotlib进行科研图表的绘制,但是Matplotlib默认的样式并不适合科研论文的出版,而SciencePlots就是为此定制的一系列科研绘图样式库,可以绘制很合适科研图表。 安装具体的安装教程可以参考该项目Github开源地址,我这里简述一下。 PIP快速安装使用下面的第一个命令安装最新版,第二个命令直接从PIP官方源下载安装,要落后最新版一个版本。 pip install git+https://github.com/garrettj403/SciencePlots.git
pip install SciencePlots
手动安装上面的PIP安装会自动下载所有的*.mplstyle文件并将其放在当前环境的matplotlib的stylelib文件夹下,这个步骤也可以手动完成。Clone官方仓库到本地,将其中style文件夹下的所有以mplstyle为后缀的文件拷贝到matplotlib的资源目录下的stylelib文件夹,获得matplotlib资源目录可以通过下面的代码段获取。 import matplotlib print(matplotlib.get_configdir())
获得该目录后直接访问,新建stylelib文件夹(若有则不需要新建),将所有*.mplstyle文件放到该目录下即可。 
使用在所有的样式中,science.mplstyle为最核心的样式,使用该样式的方法和matpl切换样式的方法一致。 import matplotlib.pyplot as plt plt.style.use('science')
当然,也可以指定多个样式,如下面这段代码中,ieee样式在某些部分会覆盖science样式以达到绘图需求。 import matplotlib.pyplot as plt plt.style.use(['science','ieee'])
上面这几种方法都是对整个脚本生效的,想要对某个部分绘图的代码生效,则只需要使用with语句进行上下文管理即可。 with plt.style.context(['science', 'ieee']): plt.figure() plt.plot(x, y) plt.show()
案例下面三个图是science样式、science+ieee以及science+ieee+grid样式的效果,在样式中加入no-latex以禁用Latex字体渲染,这是因为science样式默认采用Latex渲染,若没有安装Latex或者考虑到其比较耗时,禁用即可。 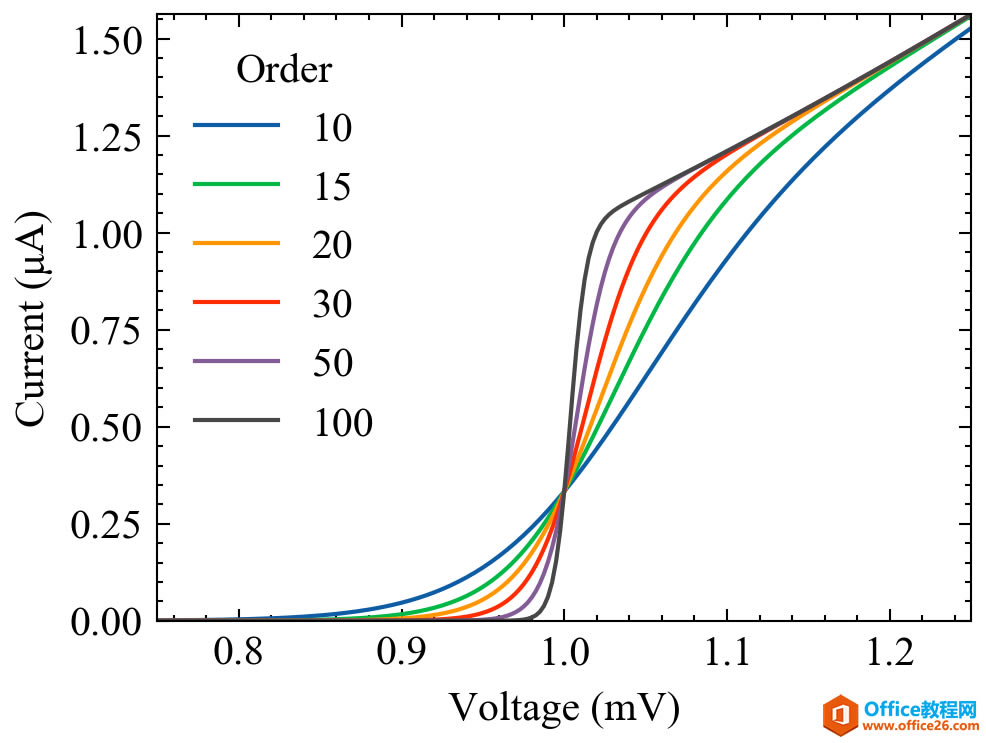
science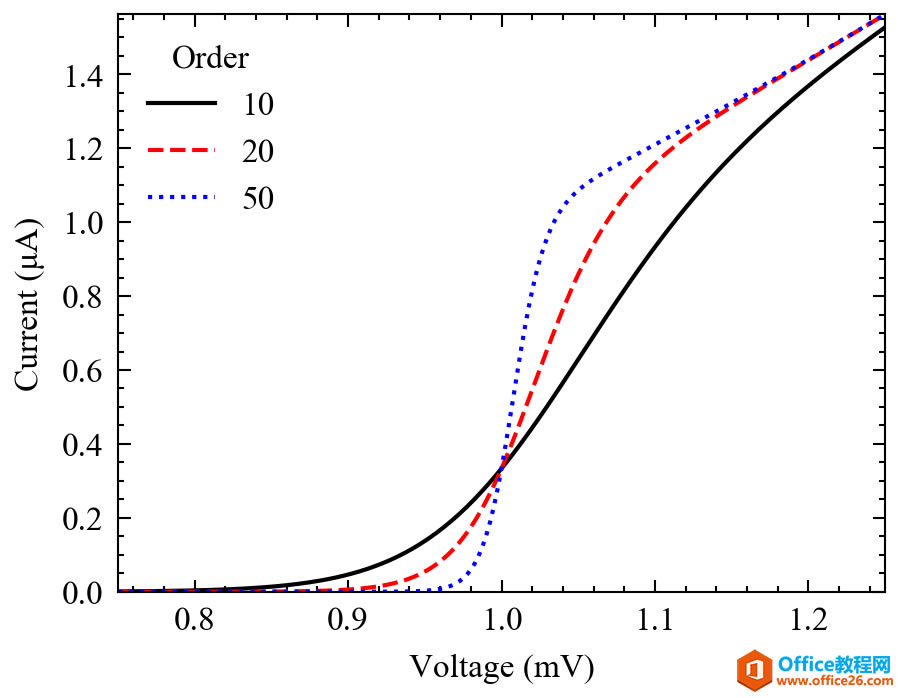
science+ieee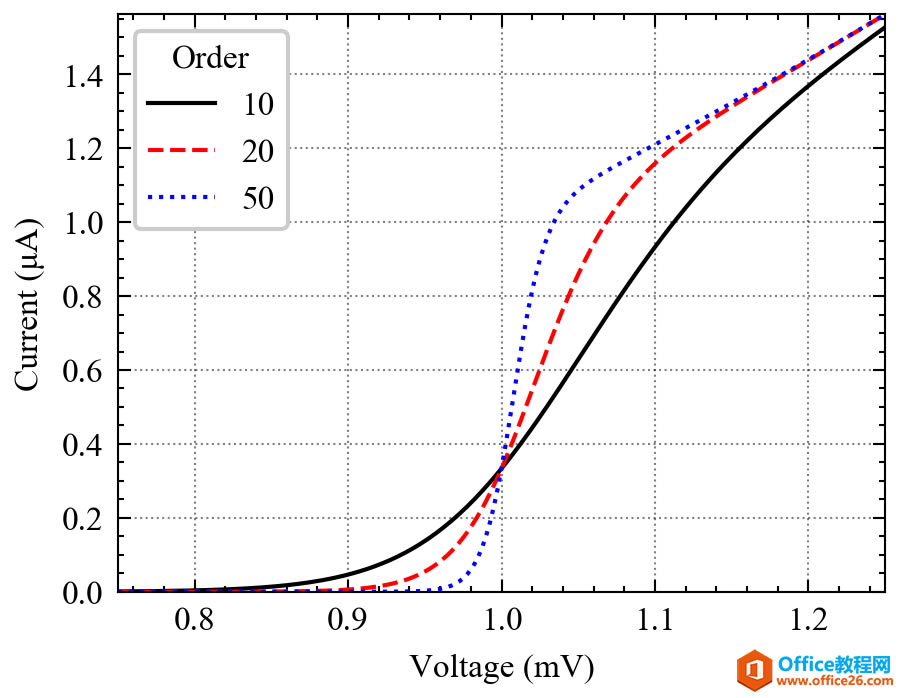
science+ieee+grid上述效果的代码如下。 import numpy as np import matplotlib.pyplot as plt def model(x, p): return x ** (2 * p + 2) / (2 + x ** (2 * p)) x = np.linspace(0.75, 1.25, 201) with plt.style.context(['science', 'no-latex']): fig, ax = plt.subplots() for p in [10, 15, 20, 30, 50, 100]: ax.plot(x, model(x, p), label=p) ax.legend(title='Order') ax.set(xlabel='Voltage (mV)') ax.set(ylabel='Current (μA)') ax.autoscale(tight=True) fig.savefig('fig1.png', dpi=300) with plt.style.context(['science', 'ieee', 'no-latex']): fig, ax = plt.subplots() for p in [10, 20, 50]: ax.plot(x, model(x, p), label=p) ax.legend(title='Order') ax.set(xlabel='Voltage (mV)') ax.set(ylabel='Current (μA)') ax.autoscale(tight=True) fig.savefig('fig2.png', dpi=300) with plt.style.context(['science','ieee', 'grid', 'no-latex']): fig, ax = plt.subplots() for p in [10, 20, 50]: ax.plot(x, model(x, p), label=p) ax.legend(title='Order') ax.set(xlabel='Voltage (mV)') ax.set(ylabel='Current (μA)') ax.autoscale(tight=True) fig.savefig('fig3.png', dpi=300)
- 1
- 2
- 3
- 4
- 5
- 6
- 7
- 8
- 9
- 10
- 11
- 12
- 13
- 14
- 15
- 16
- 17
- 18
- 19
- 20
- 21
- 22
- 23
- 24
- 25
- 26
- 27
- 28
- 29
- 30
- 31
- 32
- 33
- 34
- 35
- 36
- 37
- 38
- 39
补充说明如果有论文里绘图想要使用Matplotlib又不想花费太多精力定制绘图样式,SciencePlots是很不错的选择,已经有不少发表的文章采用该库了,感兴趣可以尝试一下。
| 